
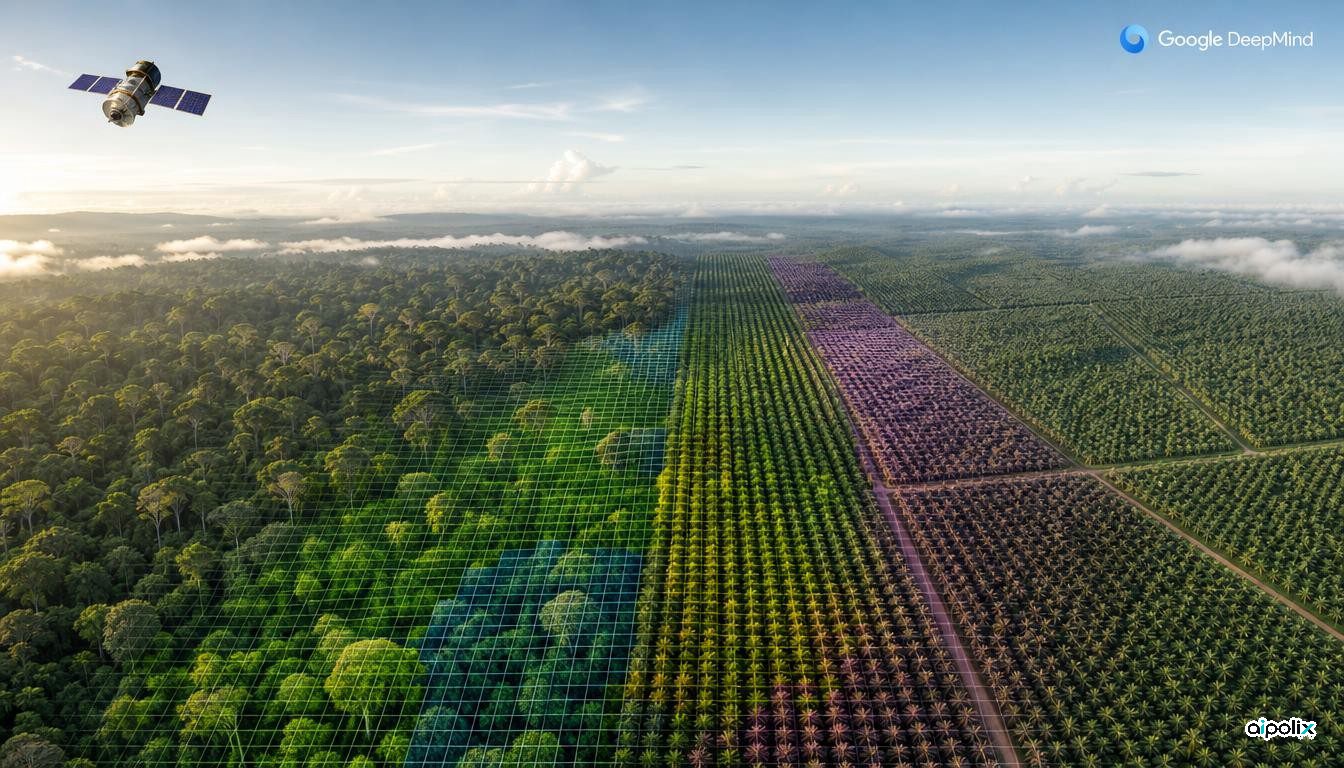
From orbit, an untouched rainforest, a stand of eucalyptus grown for timber and a palm oil estate can all look like the same green patch. Google DeepMind and Google Research, together with IIASA (International Institute for Applied Systems Analysis) and the World Resources Institute, released a model-built map on October 22 designed to tell them apart. Forest Typology 2020, or ForTy, assigns every 10-by-10-meter square of land on Earth to one of six forest and land-use types, and comes with an early yearly series covering 2017 through 2025.
The practical driver is regulation. The European Union's rules on deforestation-free products bar goods such as coffee, cocoa and palm oil grown on land that was forest at the end of 2020 and later cleared for farming, and timber that comes from primary or naturally regrowing forest later converted to plantations. Simple tree-cover maps cannot answer those questions. ForTy follows the same partners' Natural Forests of the World 2020 map from last year, which only separated natural forest from everything else.
The six classes follow definitions set by the FAO, the UN's food and farming agency: primary forest, naturally regenerating forest, planted forest, plantation forest, tree crops and agroforestry, and other land. Because some of these depend on how land is managed rather than how it looks, the team built a training set of roughly 1.7 million labeled points, taken from expert field surveys, country and regional data, and focused checks on places the model had misread. The model takes as a key input embeddings from AlphaEarth Foundations, Google DeepMind's compact digests of multiyear satellite imagery for every pixel, which help it pick up planting patterns, growth cycles and harvest rhythms.
On accuracy, the partners checked the map at more than 9,000 randomly chosen sites, where two trained experts examined high-resolution imagery and satellite history. ForTy identified the correct forest type 90% of the time and separated forest from non-forest 95% of the time, which the team says beats other global forest maps. Instead of a single label, each pixel carries a probability for every class, so a company screening suppliers can apply a strict threshold while a researcher estimating total forest area can use the full range.
The yearly series is where hidden change shows up. When a natural forest is cut and replanted as a plantation, the land quickly turns green again and standard maps can miss the switch. ForTy's time series is meant to flag those conversions, along with regrowth on abandoned land.
The 2020 map, described in the journal Scientific Data, and the time series can be used at no cost on Google Earth Engine, with an open license. The team calls the time series an early release that it will keep refining with partners and users, so its figures may shift. The accuracy numbers come from the developers' own validation with their partners rather than an outside audit, and how regulators will treat a probabilistic AI map in EUDR compliance remains to be seen.