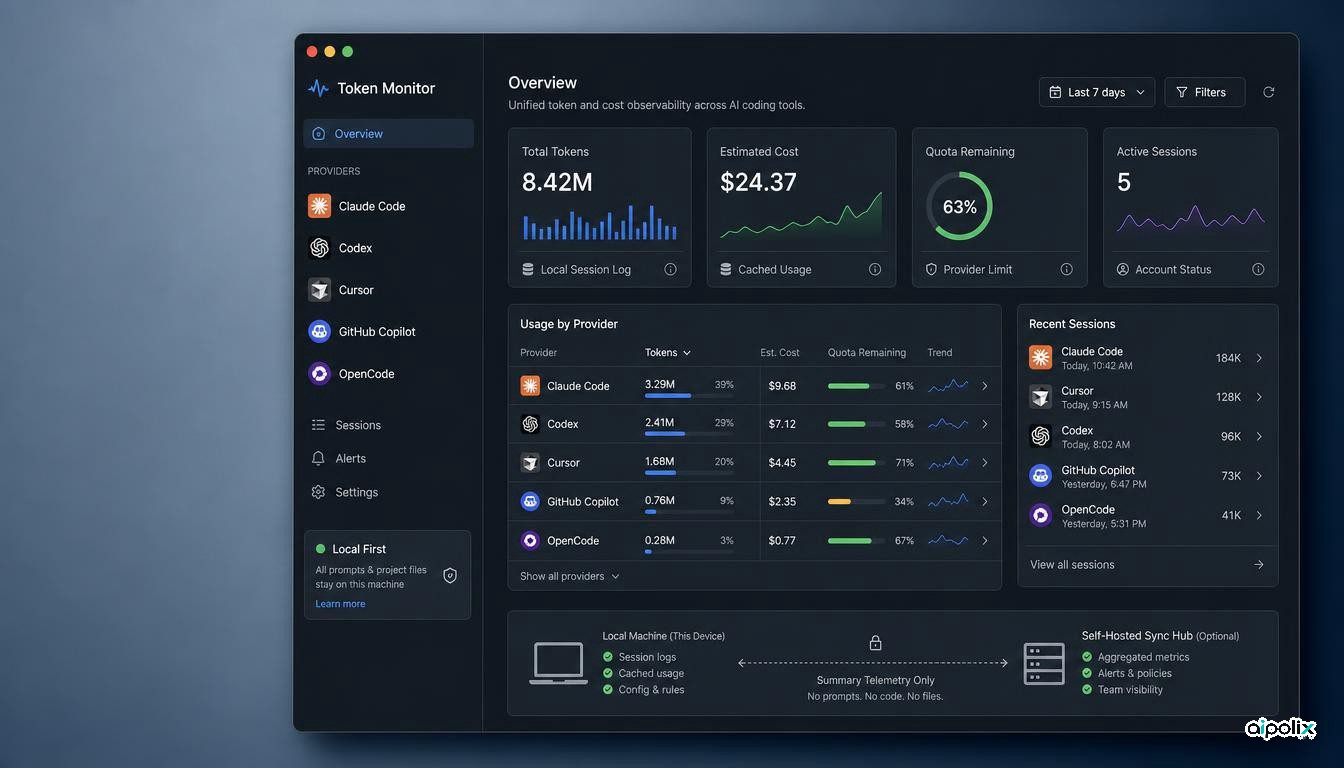
Token Monitor has moved into an interesting part of the AI coding stack: not model selection or code generation, but operational visibility. The open-source desktop application brings usage, estimated cost, quota and session signals from multiple AI coding tools into one interface. Homebrew currently lists version 0.51.0, while Trendshift records a recent rise to GitHub Trending as the project gained attention.
That matters because AI-assisted development is increasingly a multi-tool workflow. A developer may move between Claude Code, Codex, Cursor, GitHub Copilot, OpenCode and other assistants during the same week, but each provider exposes usage and limits differently. Token Monitor's repository and official project page position the application as a single view over those fragmented signals.
The product is normalization, not token counting
Counting tokens is not the difficult part. The harder problem is that the underlying data does not have one common shape. Token Monitor's own coverage matrix distinguishes between usage tracking, provider limits and per-session detail, and support varies by tool. Some integrations can read local session data, while others depend on provider status, account information or helper caches.
That makes Token Monitor closer to an observability adapter than a universal meter. It turns heterogeneous provider signals into a common operational view, which is useful for answering questions such as which tool is consuming most of a developer's AI budget, whether a quota window is close to exhaustion, or how usage changes between models.
The limitation follows from the same architecture. A number shown in one provider panel may not have exactly the same provenance, freshness or accounting semantics as a number shown in another. A unified interface can make different signals look more comparable than they really are.
Local-first reduces data movement
The project's official documentation says local mode works without an account or cloud service and reads local usage through tokscale. Multi-device history and synchronization are optional. For users who enable sync, the project documents self-hosted hub options and says the synchronized payload contains summary usage, cost, tool and model breakdowns and normalized account-limit status rather than raw prompts, source files, conversation transcripts or OAuth credentials.
That is a meaningful design choice for developer tooling. Coding assistants often operate around repositories, terminals and credentials, so minimizing what leaves the machine reduces one class of privacy exposure.
Local-first, however, should not be interpreted as no trust boundary. A monitoring application still needs visibility into local usage artifacts, and some provider-limit integrations may require account-specific access methods. Teams deploying it on managed developer machines should review which adapters are enabled, what each adapter reads, where optional synchronization is hosted and who can access the resulting telemetry.
Cross-tool visibility is becoming an engineering need
Vendor dashboards are designed to explain one vendor's consumption. They are less useful when a team deliberately mixes assistants or changes tools based on task, model availability, quota or cost. That fragmentation makes it difficult to answer a basic operational question: how much AI-assisted development capacity is actually being consumed across the toolchain?
Token Monitor gives developers a way to see that activity without manually opening several account pages. For individual developers, the gain is convenience. For teams, the more interesting possibility is identifying usage patterns before they become cost or availability surprises.
This does not make the project a FinOps system by itself. Team-level budgeting, chargeback and procurement decisions need stronger guarantees around identity, data retention, metric definitions and reconciliation with provider invoices. But an operational view can still expose where those controls are missing.
Useful telemetry is not an authoritative billing ledger
The most important caution is semantic. Usage, quota and session data are different classes of evidence. A local log can show what a client recorded. A provider API can show what an account reports. A cached limit indicator can show remaining capacity. None of those automatically equals the provider's final bill.
For that reason, Token Monitor is best treated as a developer observability layer rather than an accounting source of truth. If an organization wants to use its numbers for budget enforcement or internal chargeback, it should preserve metric provenance and reconcile totals against official invoices or billing APIs.
This is also where the project has room to become more consequential. The stronger the provenance, freshness and error-state information around every normalized metric, the safer it becomes to automate alerts or policy around the dashboard. Without that context, a clean visualization can hide uncertainty.
What the current momentum actually signals
Version 0.51.0 being packaged in Homebrew and the project's recent GitHub Trending visibility are useful release signals, but popularity is not proof of technical quality. They are better read as evidence that developers recognize the underlying problem: AI coding usage is spreading across enough tools that a cross-vendor monitor now solves a real workflow pain.
The project should therefore be judged less by star count and more by how reliably it normalizes incompatible telemetry while keeping its access boundaries understandable. If those two properties hold, Token Monitor can become a practical observability layer for AI-assisted software development. If they do not, one dashboard simply concentrates several ambiguous counters in one place.